Track and trade in one place: use Portfolio in the 1inch dApp
In the 1inch dApp, Portfolio lets users track assets and explore DeFi in one place.
Why use Portfolio?
The Portfolio tab in the 1inch dApp is a powerful tool designed to help you track your assets and discover new opportunities. It’s suitable for users of all experience levels – from those managing a few tokens to those engaging with multiple protocols.
Key features
Overview: Get a full analytics breakdown of your Web3 assets. View performance across multiple timeframes and networks to support better decisions.
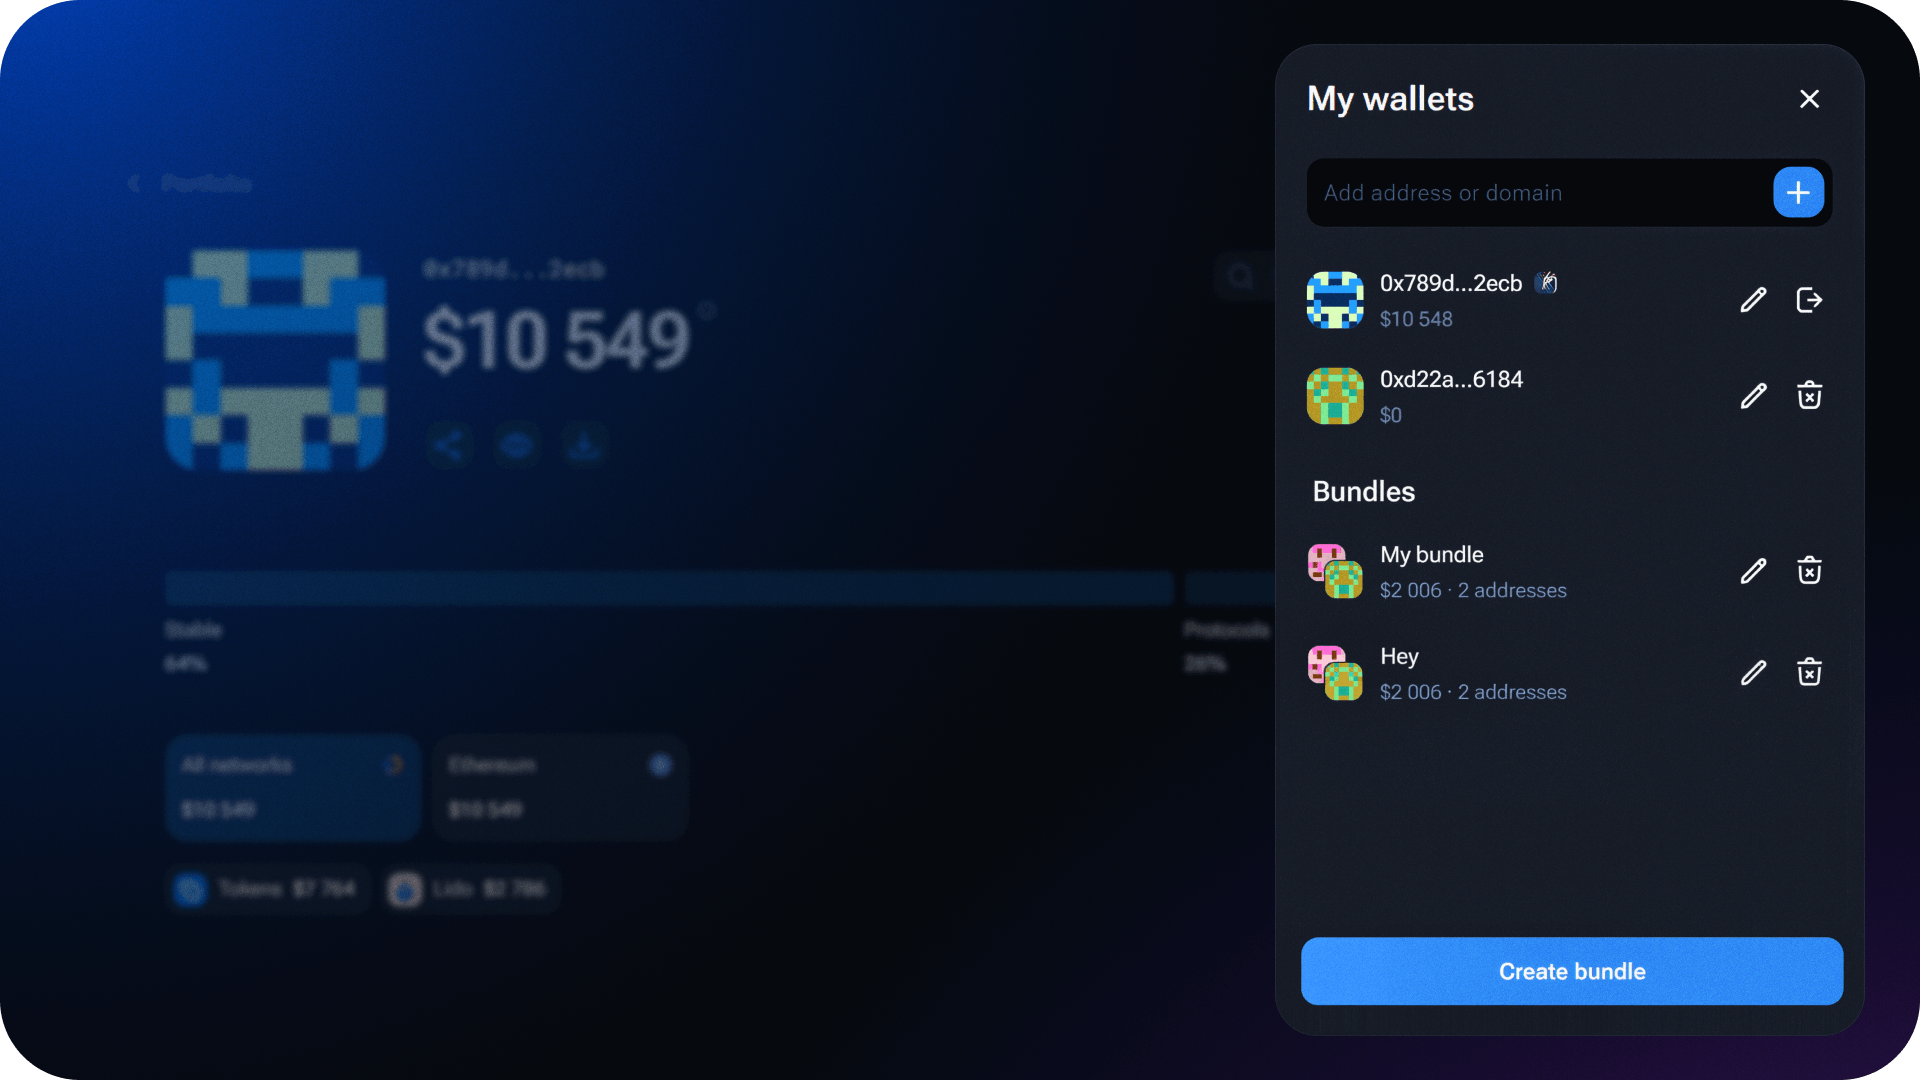
Wallet bundles: Group multiple wallets to monitor their combined performance. Bundles make it easier to switch between views without manually selecting wallets each time.
Explore: Compare potential opportunities across protocols, chains and tokens.
How to use Portfolio in the 1inch dApp
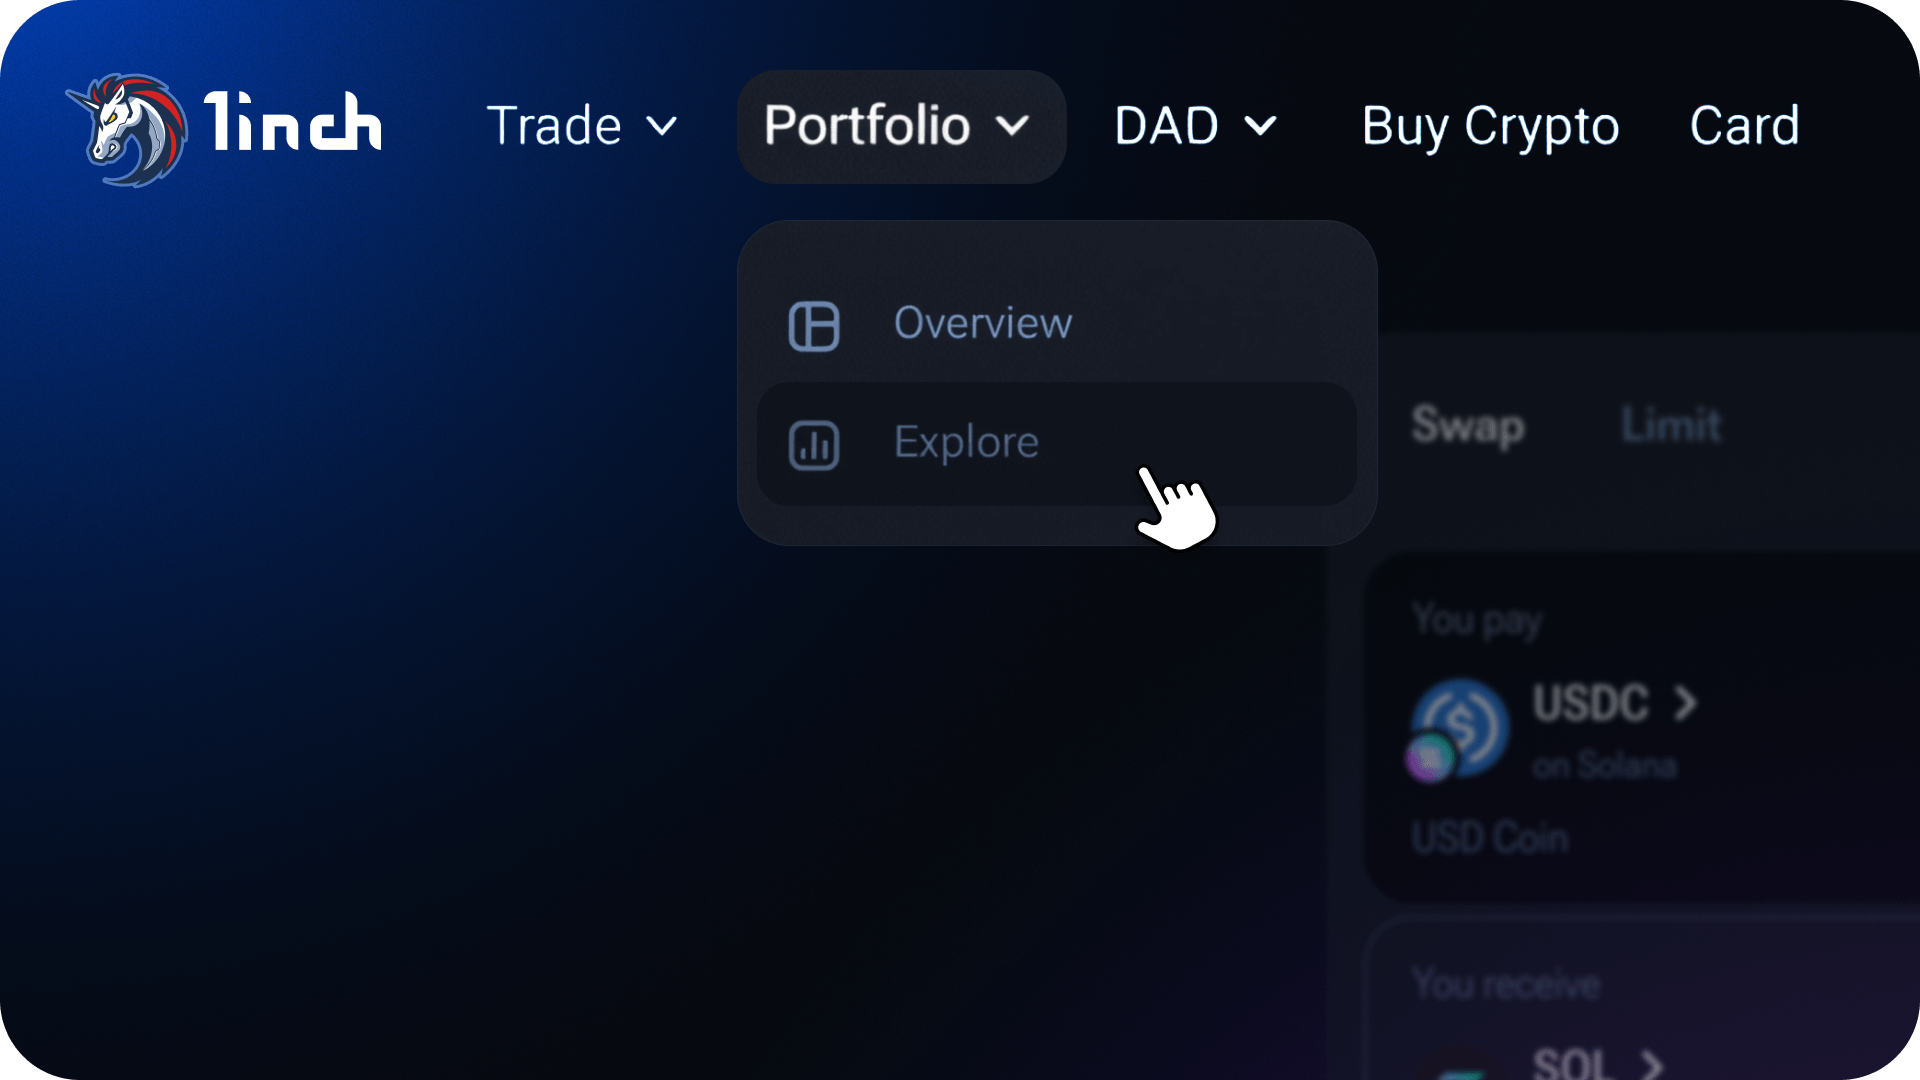
- Open the 1inch dApp, then connect your wallet.
- Go to the Portfolio tab, then choose either Overview or Explore from the menu.
Using the Overview tab
The Overview tab provides a complete picture of the performance of your assets across selected wallets and networks.
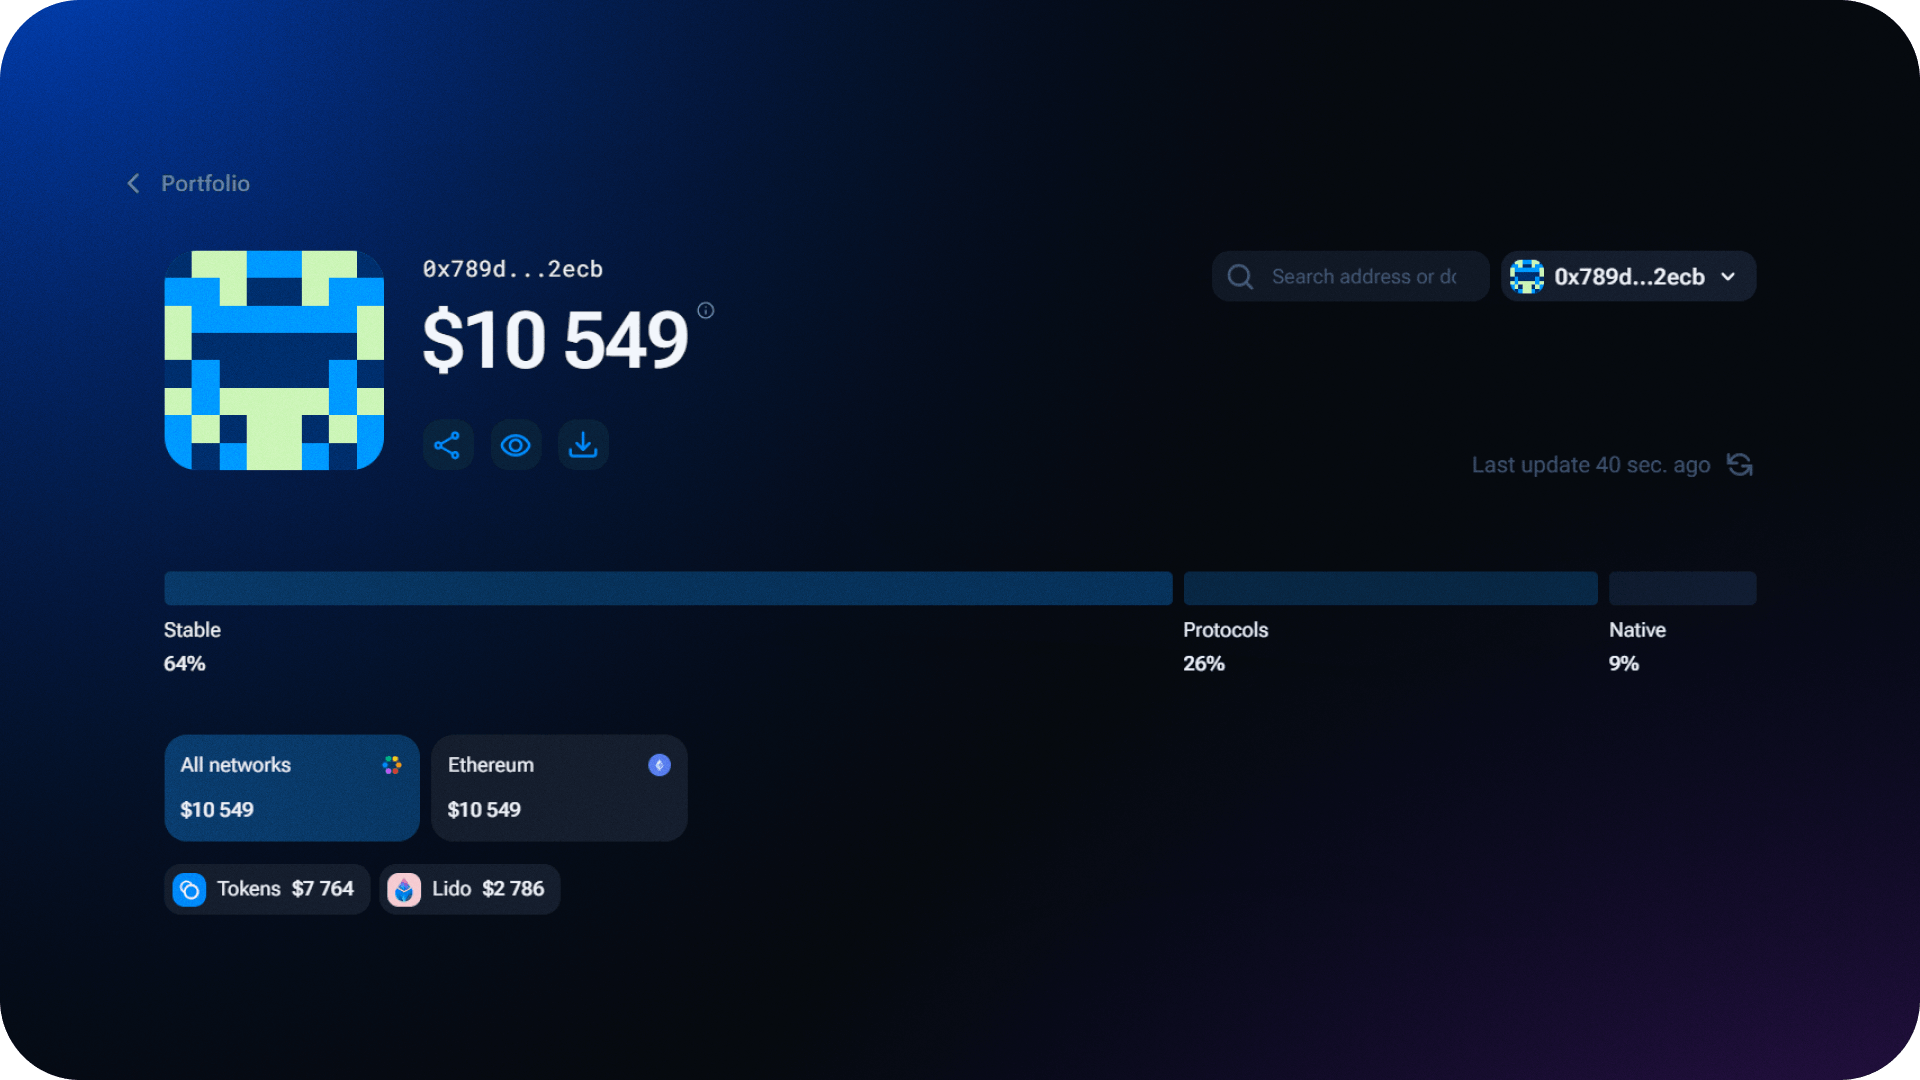
To manage multiple wallets more efficiently, you can group them into a bundle. Tap your wallet address, add more wallets and click Create bundle to track their combined performance in one view.
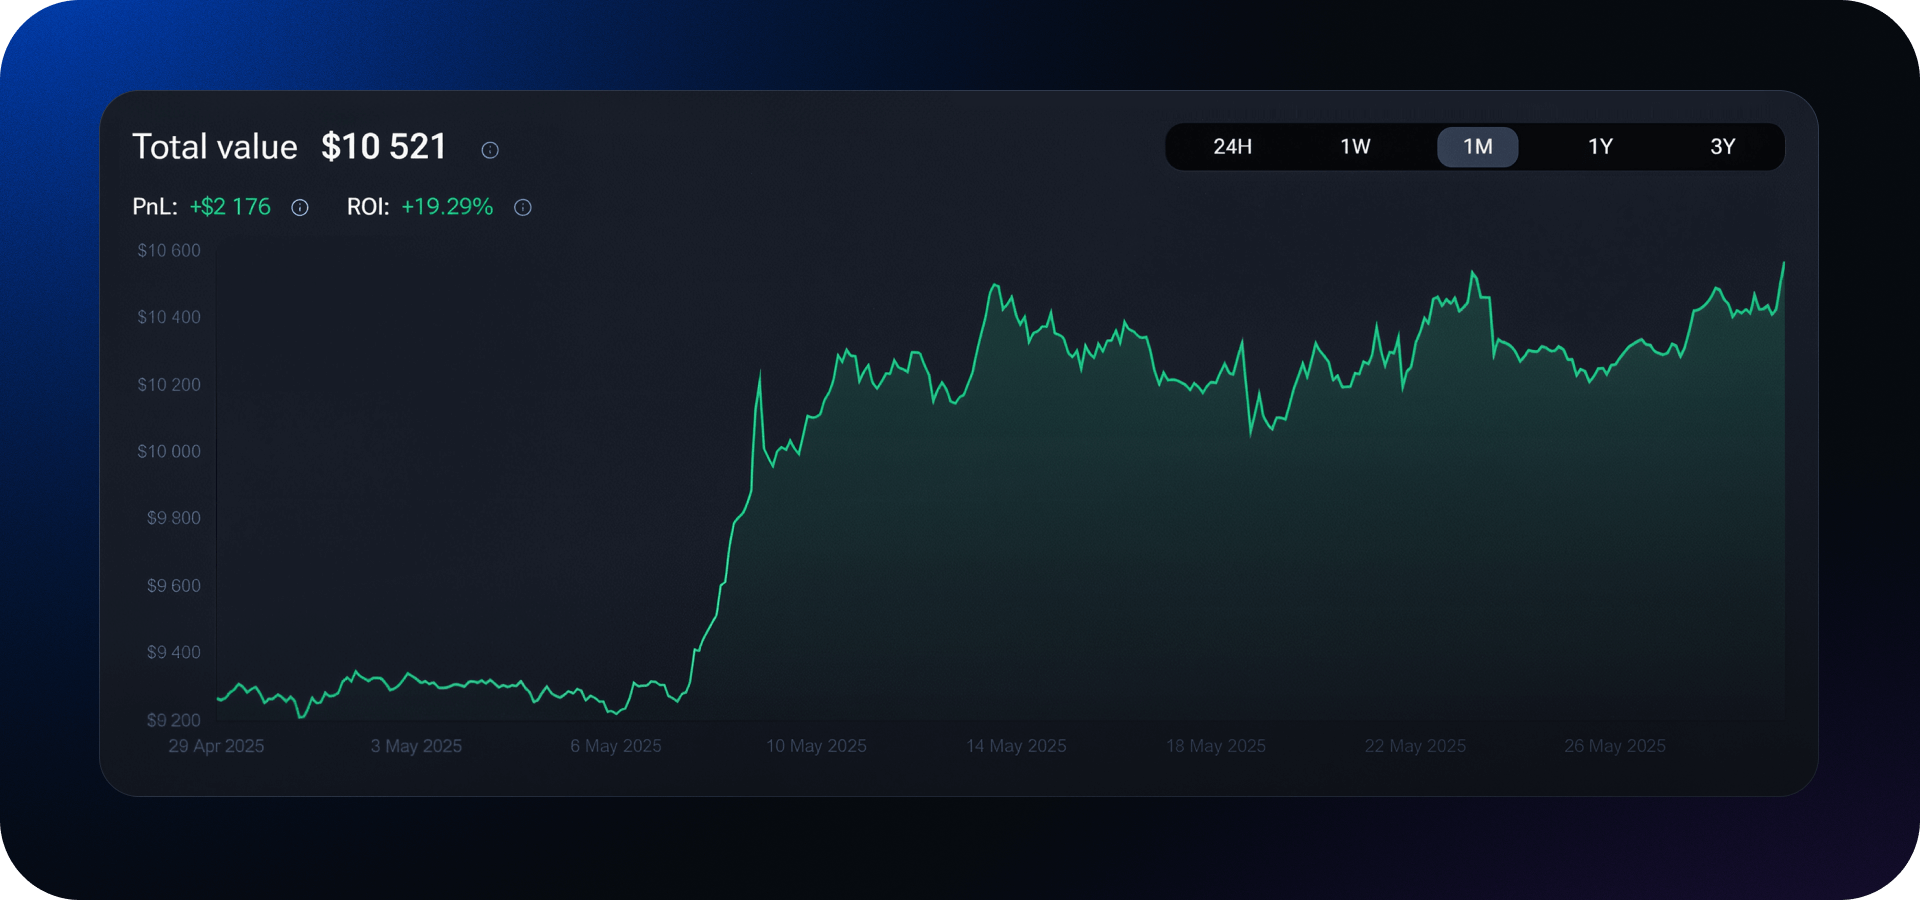
Total value chart
The first chart displays the total value of assets in the selected wallets. You can analyze profit and loss (PnL) and return on investment (ROI) across different timeframes – from 24 hours to 3 years. It’s also possible to filter data by blockchain network.
- PnL = Current value − Inflows + Outflows
- ROI = PnL ÷ Inflow (as a percentage)
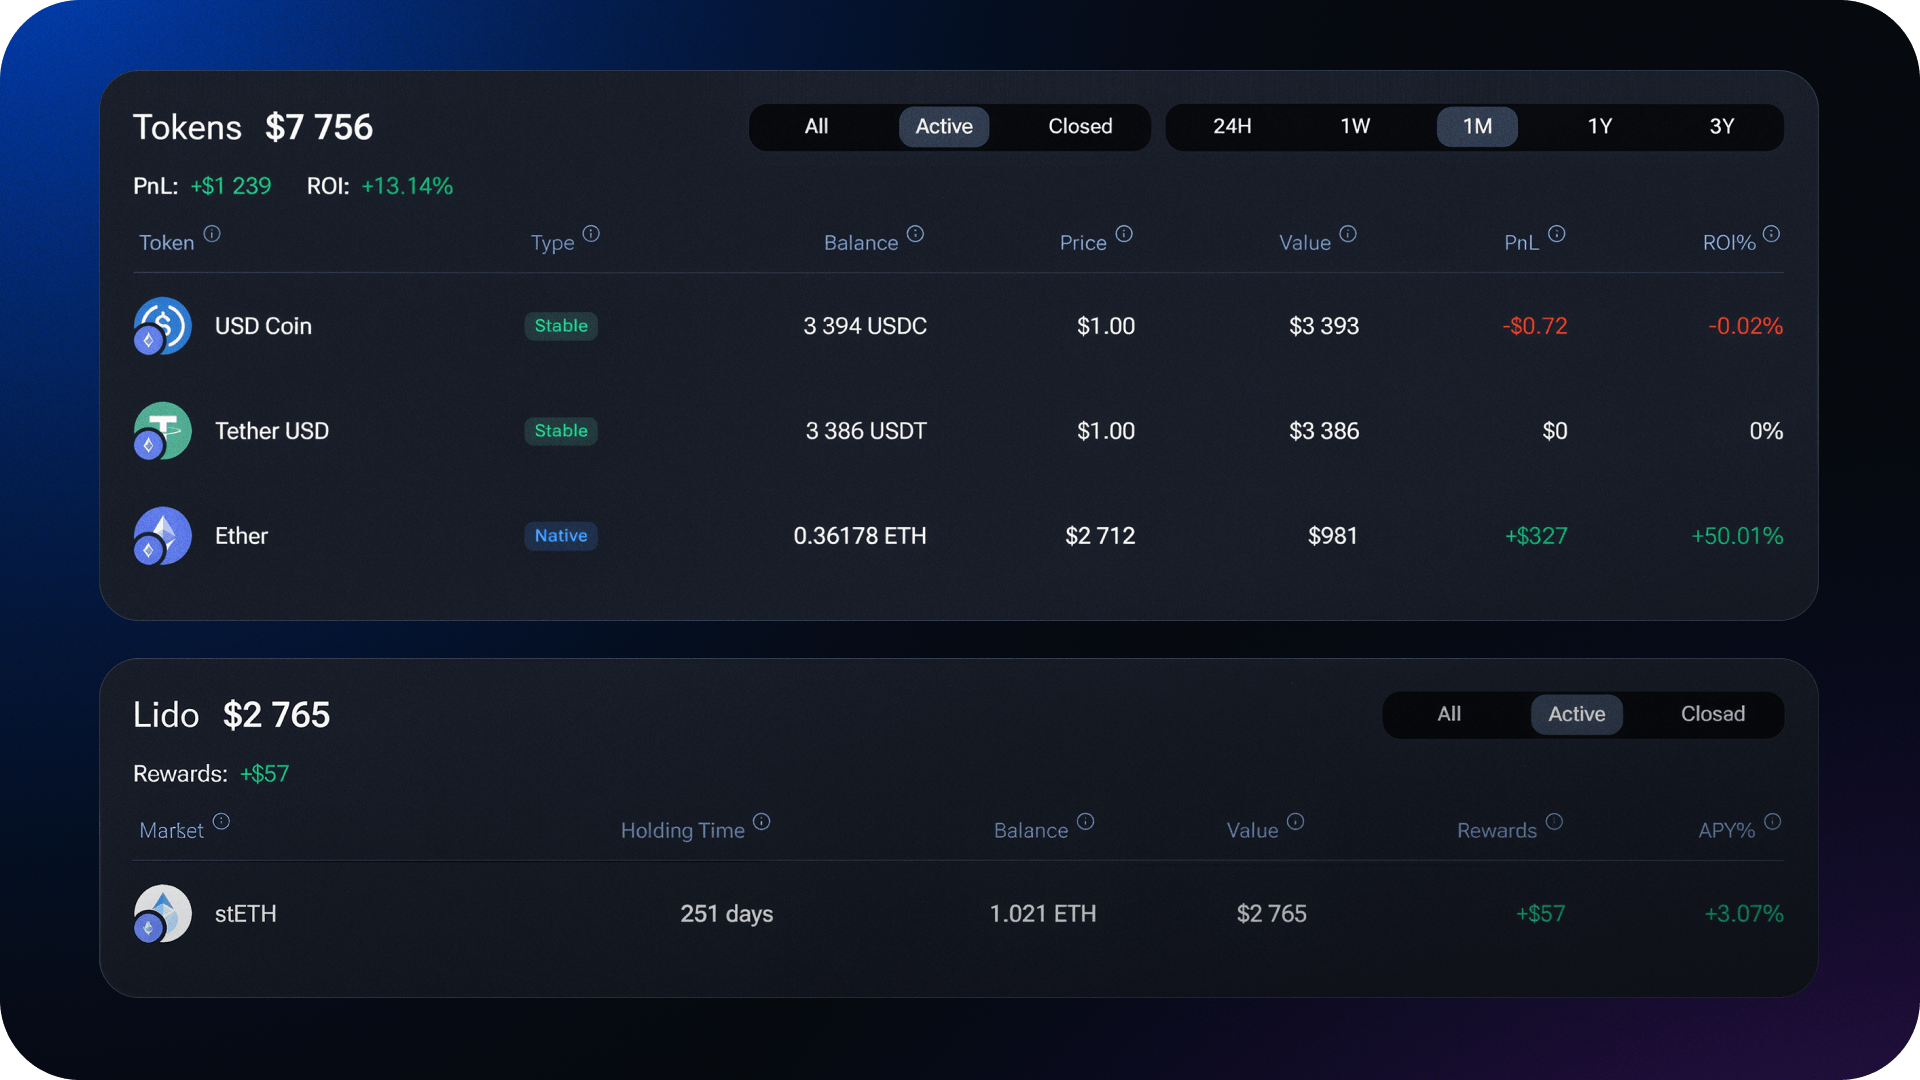
Token performance table
This section provides detailed information about each token in the selected wallets. For each token, it displays balance, price, value, PnL, ROI, average purchase price, and transaction history. Both active and closed (withdrawn) positions are included.
Protocol-specific charts
Additional charts show how assets are performing in various DeFi protocols. For each supported protocol, you can view your aggregated PnL, APY and fees earned. If multiple wallets are selected, the data is consolidated across them.
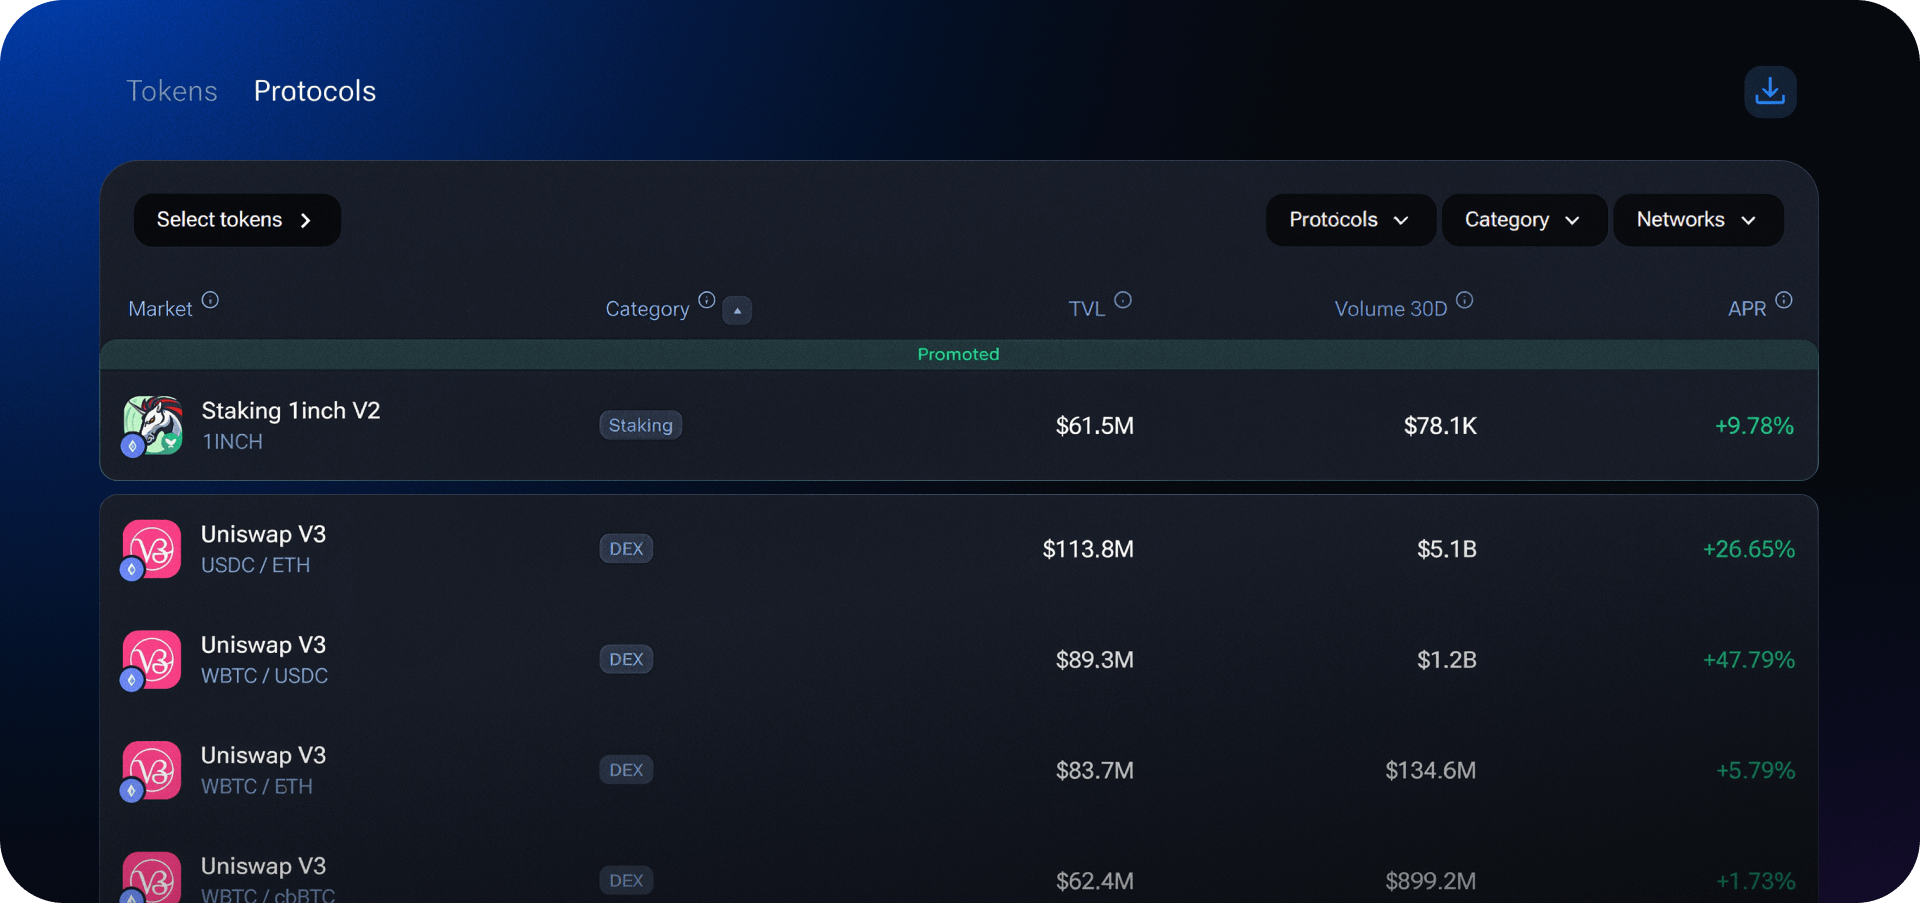
Discover opportunities with Explore
The Explore tab offers a detailed overview of both tokens and protocols, helping users discover opportunities across different DeFi ecosystems.
In the Tokens section, users can view real-time data including current price, 24-hour price change, trading volume and market capitalization. Tokens can also be filtered by blockchain, allowing for a more targeted view of specific networks.
The Protocols section displays key metrics such as total value locked (TVL), volume over the last 30 days and annual percentage rate (APR) – an estimate of the potential return from interacting with the protocol. Protocols can be filtered by chain and sorted into categories, making it easier to navigate and compare available options.
With the Portfolio, the 1inch dApp offers a complete, user-friendly dashboard that combines tracking, management and discovery in one place. Whether you're optimizing strategies or just keeping an eye on performance, it's all just a click away.
Stay tuned as we continue to improve and unify your Web3 experience!
Share the article